授業連動データのダウンロード
授業連動データ(Arduino〜Max)2018.1.24

授業連動データ(Arduino〜Max)2018.1.24
「Arduino+ECM」の回路をそのまま利用する。
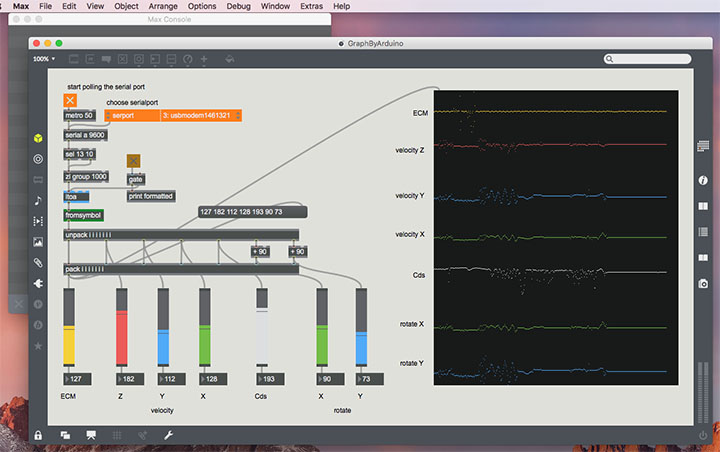
シリアル通信を利用して、ArduinoのセンサーデータをMaxへ送信し、グラフ表示を行う。
空のスケッチを作成して、以下のコードをコピー&ペースト後、スケッチを保存する。
// ECM、加速度、CdsをMaxで視覚化(Arduino側)
// 2018.1 nakayasu

int sensorValue[5];
int outputValue[5];

void setup()
{
  for(int k=0; k < 5; k++){
    sensorValue[k] = 0;
    outputValue[k] = 0;
  }
  Serial.begin(9600);
}

void loop()
{
    sensorValue[0] = analogRead(0); //ECM
    delay(10);
    sensorValue[1] = analogRead(1); //A1ピン入力 - Z(KXM52-1050の8pin)
    delay(10);
    sensorValue[2] = analogRead(2); //A2ピン入力 - Y(KXM52-1050の7pin)
    delay(10);
    sensorValue[3] = analogRead(3); //A3ピン入力 - X(KXM52-1050の6pin)
    delay(10);
    sensorValue[4] = analogRead(5); //CdS
    delay(10);

    // センサー値をシリアル通信用に10bit(0〜1023)から8bitへ(0〜255)変換する
    outputValue[0] = map(sensorValue[0], 0, 1023, 0, 255);
    outputValue[1] = map(sensorValue[1], 0, 1023, 0, 255);
    outputValue[2] = map(sensorValue[2], 0, 1023, 0, 255);
    outputValue[3] = map(sensorValue[3], 0, 1023, 0, 255);
    outputValue[4] = map(sensorValue[4], 0, 1023, 0, 255);

    //角度値の計算
    //センサー値を-1から1までの範囲にスケーリングしてsinθの値とする
    float xAxisSinTheta = mapInFloat(sensorValue[3], 306, 716, -1, 1);
    float yAxisSinTheta = mapInFloat(sensorValue[2], 306, 716, -1, 1);
    //値を-1から1までの範囲に制限
    xAxisSinTheta = constrain(xAxisSinTheta,-1,1);
    yAxisSinTheta = constrain(yAxisSinTheta,-1,1);
    //逆サインのラジアンを度に変換する
    int xAxisTilt = float(asin(xAxisSinTheta) * 180 / PI );
    int yAxisTilt = float(asin(yAxisSinTheta) * 180 / PI );

    // シリアル送信
    Serial.print(outputValue[0]);
    Serial.print(" ");
    Serial.print(outputValue[1]);
    Serial.print(" ");
    Serial.print(outputValue[2]);
    Serial.print(" ");
    Serial.print(outputValue[3]);
    Serial.print(" ");
    Serial.print(outputValue[4]);
    Serial.print(" ");
    Serial.print(xAxisTilt);
    Serial.print(" ");
    Serial.print(yAxisTilt);
    Serial.println();
    delay(50);
}

void establishContact() { // シリアル通信が確立されるまでAを送信し続ける
  while (Serial.available() <= 0) {
    Serial.print('A');
    delay(300);
  }
}

float mapInFloat(float x, float iMin, float iMax, float oMin, float oMax) {
  return (x - iMin) * (oMax - oMin) / (iMax - iMin) + oMin;
}
Arduinoスケッチデータのダウンロード
コンパイル、書き込みを行う。Arduinoにプログラムを書き込んだ時点ではシリアル通信がスタートしない。Maxで受信スタート後、シリアル通信がスタートする。
以下より、グラフ表示用のMaxパッチをダウンロードする。
Maxパッチデータのダウンロード
1) Maxパッチをダブルクリックして起動する。
2) オレンジのtoggleをクリックする。
3) オレンジのプルダウンリスト(右側)からusbmodem********(Arduino)を選択する。
4)シリアル通信がスタートして、 ECM、加速度センサ、CdS、回転角度の数値がグラフ表示される。

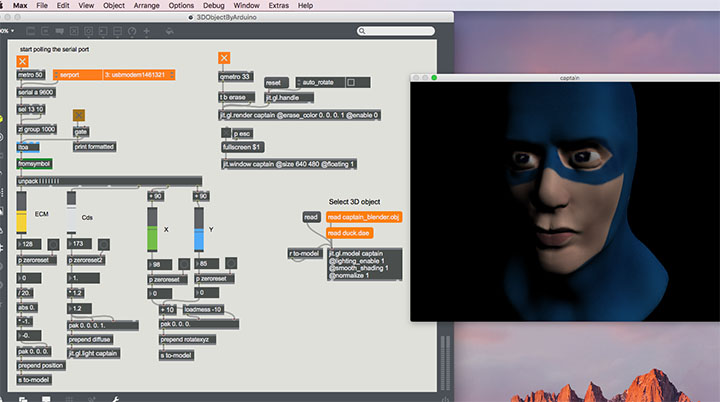
グラフ表示のスケッチと同じものを利用する。
1) Maxパッチデータと3Dモデルデータを同じ階層に配置する。
2) Maxパッチをダブルクリックして起動する。
3) オレンジのtoggle(左)をクリックする。
4) オレンジのプルダウンリスト(右側)からusbmodem********(Arduino)を選択する。
5) オレンジのtoggle(右)をクリックする。
6) オレンジのメッセージボックス「read captain_blender.obj」をクリックする。
Arduinoのアクリルボードを回転させると3Dオブジェクトが回転する。ECMに息を吹きかけると3Dオブジェクトが移動する。CdS上に手をかざして暗くすると3Dオブジェクトが暗くなる。ESCキーでフルスクリーン表示切替。
